Hi, I am Sneha Gathani

I am a 2nd year PhD student advised by Prof. Zhicheng Liu in the Human-Data Interaction Group at the University of Maryland, College Park (UMD). My research interests lie in the space of interested in the space of interactive visual data-driven decision-making systems, visual systems fostering trust in AI models, and Human-Centered AI.
I graduated with a Master's in Computer Science from UMD in May 2020. During Master's, I worked with Prof. Leilani Battle in the BAttle Data Lab (BAD Lab) in the intersection of Data Visualization, Databases and HCI. Over Masters and PhD, I have also gathered experience in the areas of database manaagement systems, computer graphics, computer vision and machine learning. Prior to grad school, I completed my Bachelors in Computer Engineering from University of Pune, India with a specialization in Computer Science.


News

October 2021 My summer research work at Sigma Computing Inc. is accepted at CIDR 2022 as a full paper
October 2021 Another summer research work at Sigma Computing Inc. is accepted at CIDR 2022 as a 1-page abstract
August 2021 I am continuing my summer intern at Sigma Computing Inc. with Çağatay Demiralp through the Fall semester
Publications

Augmenting Decision Making via Interactive What-If Analysis

Sneha Gathani, Madelon Hulsebos, James Gale, Peter J. Haas, Çağatay Demiralp
CIDR 2022: Conference on Innovative Data Systems Research | Acceptance Rate: <30%

Making Table Understanding Work in Practice

Madelon Hulsebos, Sneha Gathani, James Gale, Isil Dilling, Paul Groth, Çağatay Demiralp
CIDR 2022: Conference on Innovative Data Systems Research | Acceptance Rate: <30%

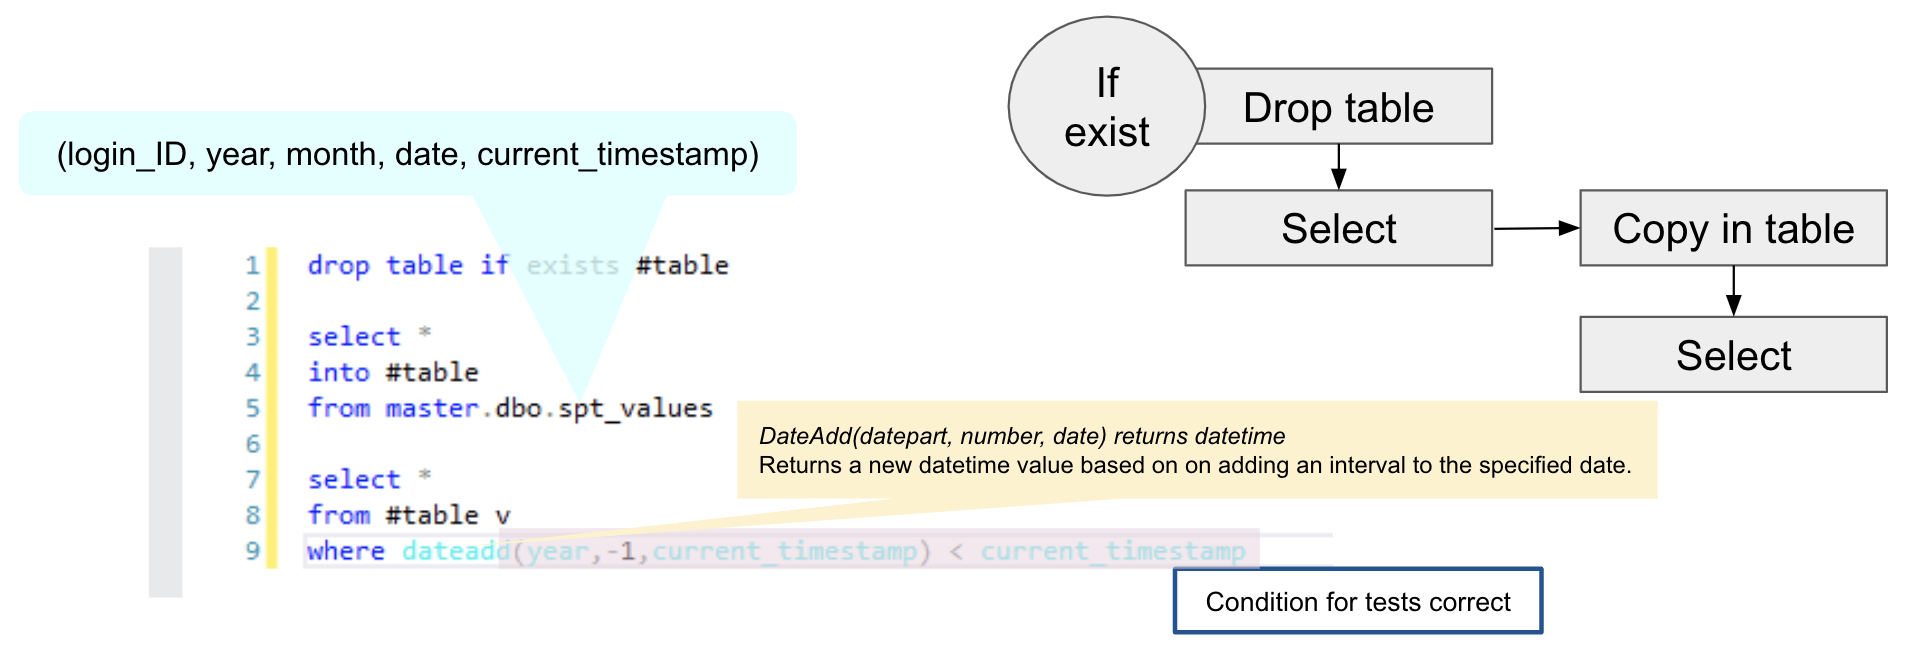
Debugging Database Queries: A Survey of Tools, Techniques, and Users

Sneha Gathani, Peter Lim, Leilani Battle
CHI 2020: SIGCHI Conference on Human Factors in Computer Systems | Acceptance Rate: 23.8%

Research

I am directed to working in the space of developing interactive visual systems that will help non-expert users go beyond exploration and finding insights from data visualization tools and help them make decisions that will benefit their interests and foster their trust and interpret AI models.


Augmenting Decision Making via Interactive What-If Analysis

Sneha Gathani, Madelon Hulsebos, James Gale, Peter J. Haas, Çağatay Demiralp

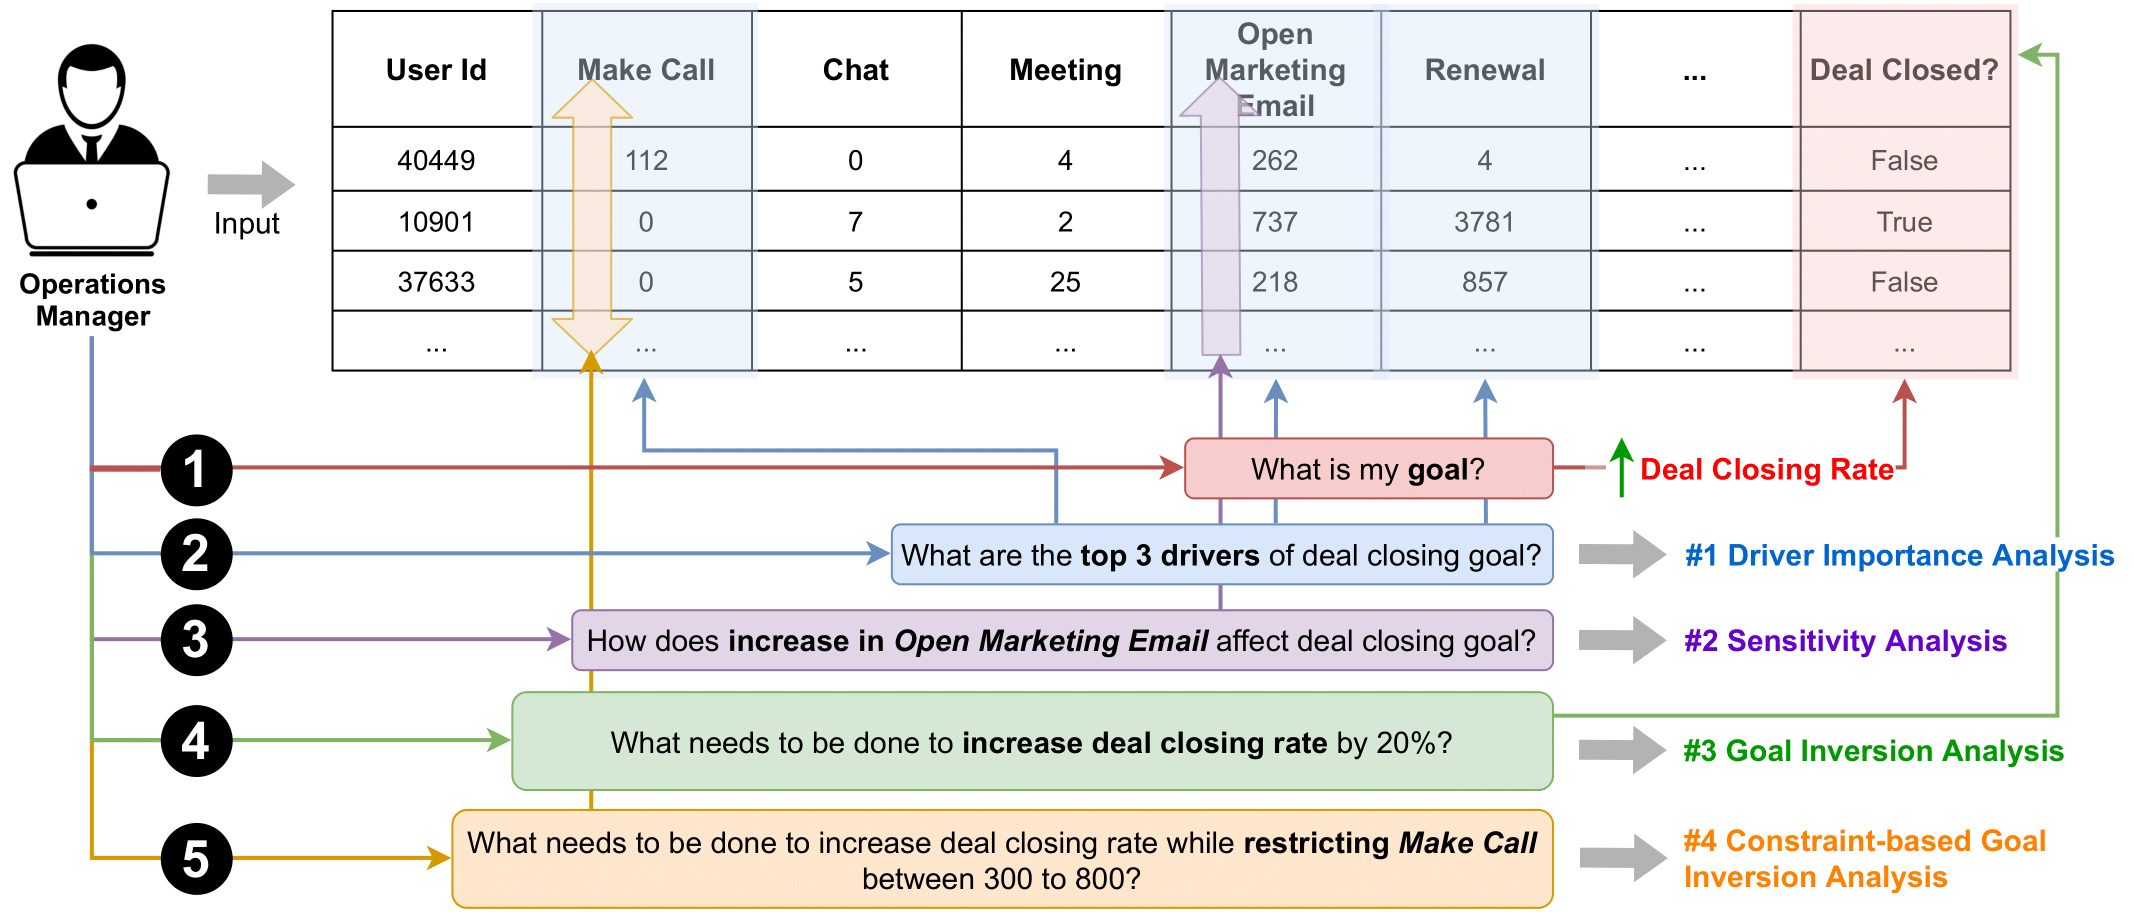
The fundamental goal of business data analysis is to improve business decisions by understanding the relationship between data and objectives. Business users such as sales, marketing, product, or operations managers often make decisions to achieve key performance indicator (KPI) goals such as increasing customer retention, decreasing investments, increasing sales, etc. To discover the relationship between data and their KPI of interest, business users perform data exploration by analyzing multiple slices of the dataset mentally. For example, analyzing customer retention across quarters of the year or suggesting optimal media channels across strata of customers. However, the increasing complexity of datasets combined with the cognitive limitations of humans makes it challenging to carry over multiple hypotheses, even for simple datasets. Therefore performing such analyses is hard mentally. Existing commercial tools provide partial solutions whose effectiveness remains unclear. They are also often developed for data scientists, not business users. Here we argue for four functionalities that we believe are necessary to enable business users to reason with insights, learn the relationships between data and KPIs, and facilitate data-driven decisions. We implement these functionalities in SigmaDecision, an interactive visual data analysis system enabling business users to experiment with the data by asking what-if questions. We evaluate the system through three business use cases: marketing mix modeling analysis, customer retention analysis, and deal closing analysis, and report on feedback from multiple business users. Overall, business users find SigmaDecision intuitive and useful for quick testing and validation of their hypotheses around interested KPI as well as in making effective and fast data-driven decisions.


CIDR 2022: Conference on Innovative Data Systems Research | Acceptance Rate: <30%


Making Table Understanding Work in Practice

Madelon Hulsebos, Sneha Gathani, James Gale, Isil Dilling, Paul Groth, Çağatay Demiralp

Understanding the semantics of tables at scale is crucial for tasks like data integration, preparation, and search. Table understanding methods aim at detecting a table's topic, semantic column types, column relations, or entities. With the rise of deep learning, powerful models have been developed for these tasks with excellent accuracy on benchmarks. However, we observe that there exists a gap between the performance of these models on these benchmarks and their applicability in practice. In this paper, we address the question: what do we need for these models to work in practice? We discuss three challenges of deploying table understanding models and propose a framework to address them. These challenges include 1) difficulty in customizing models to specific domains, 2) lack of training data for typical database tables often found in enterprises, and 3) lack of confidence in the inferences made by models. We present SigmaTyper which implements this framework for the semantic column type detection task. SigmaTyper encapsulates a hybrid model trained on GitTables and integrates a lightweight human-in-the-loop approach to customize the model. Lastly, we highlight avenues for future research that further close the gap towards making table understanding effective in practice.


CIDR 2022: Conference on Innovative Data Systems Research | Acceptance Rate: <30%


A Programmatic Approach to Evaluating Visualization Taxonomies in Log Analysis Contexts

Sneha Gathani, Alvitta Ottley, Leilani Battle

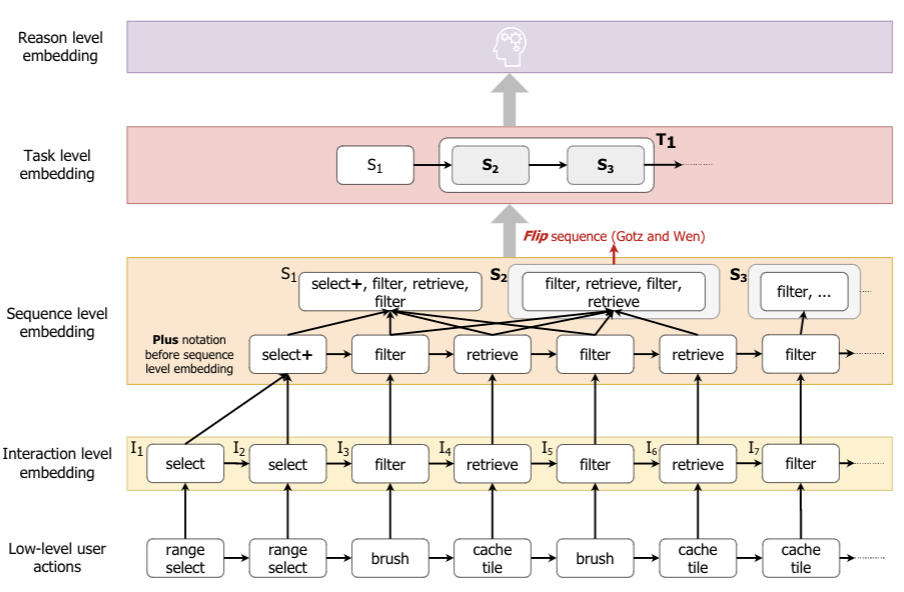
The visualization community has created many different taxonomies to guide the design and development of visualization systems. However, it is unclear how to evaluate a taxonomy, i.e. it is hard to understand which taxonomy is best for a given interaction log dataset, or even how to apply the taxonomy to a set of interaction log datasets. In this paper, we present a two-stage approach to assess whether existing taxonomies are generalizable enough to automate the way we analyze real-world interaction log datasets. First, we leverage Gotz and Zhou’s multi-tier characterization of user’s analytic activities to create a general-purpose framework that clusters 30 different visualization taxonomies by the kinds of interaction log analyses they can support. Our framework has four levels: interaction level, sequence level, task level and reason level. Second, we present a novel process for programmatically mapping different taxonomies to interaction log datasets. Specifically, we develop programmable templates that can label interaction logs with their corresponding categories from a given taxonomy. We refer to these templates as embeddings. Our embeddings enable easy translation from one taxonomy to another and ease hand-offs between adjacent levels of our framework, such as passing the output of an interaction level taxonomy as input to a sequence level taxonomy. We create seven embeddings for taxonomies from the first two levels of our framework (interaction and sequence), allowing us to quantitatively measure the applicability of these taxonomies to three real-world visualization interaction log datasets. However, we find the applicability of these taxonomies to be severely limited at both levels. Our findings suggest that existing taxonomies are not well-suited to support a wide range of user interactions across visualization systems. Based on our findings, we make recommendations on how existing taxonomies could be augmented, or new taxonomies could be developed, to better support and guide user interactions.


TraceInspector: A Visualization-based Reverse Engineering Tool for Android Apps

Sneha Gathani, Daniel Votipka, Kristopher Micinski, Jeffrey Foster, Michelle Mazurek, Leilani Battle

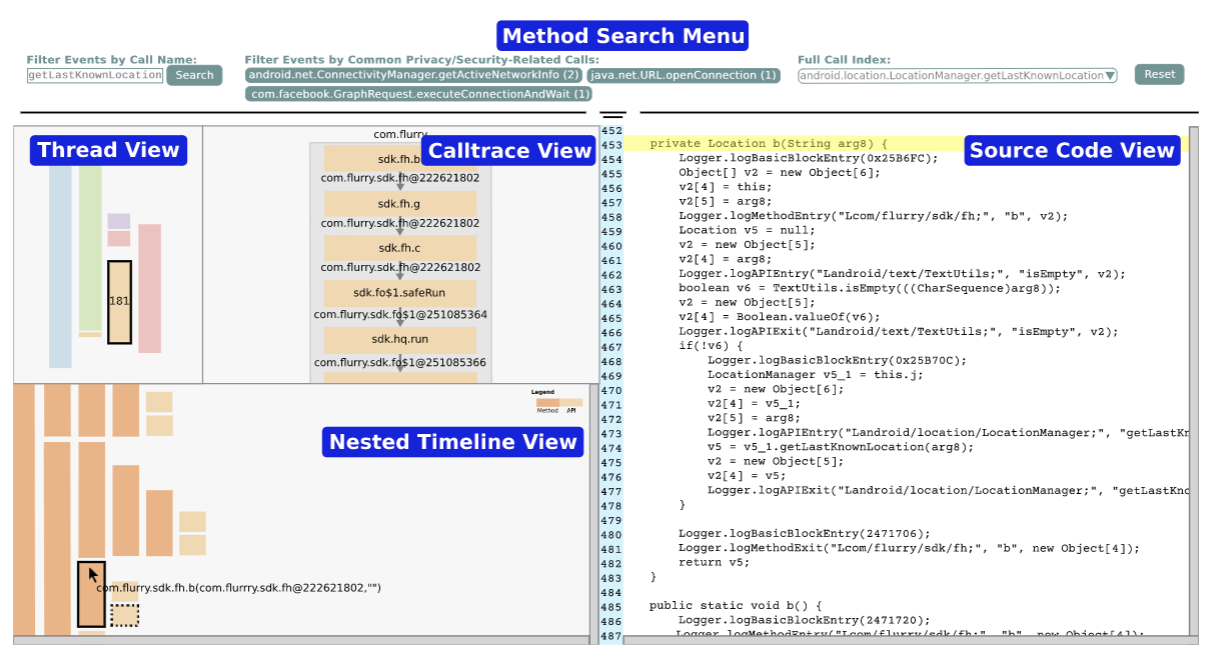
With over 2 billion Android users, it is critical to understand the degree of security and privacy provided by Android applications (or apps). However, security analysts must reverse engineer (RE) these apps in order to analyze them. To develop an accurate understanding of an app's behavior, Android RE users use a mix of tools that enable them to perform a fine-grained review of app bytecode (e.g., JEB, BinaryNinja, and IDA Pro) and program execution (e.g., gdb, Xposed, redexer). However, no single tool exists to help RE users combine this information. Further, there is no tool currently available that provides a simple way to quickly review dynamically generated app execution logs, which can contain millions of (mostly irrelevant) events. In this paper, we present TraceInspector, an interactive visualization tool that acts as a centralized resource for completing Android RE tasks. TraceInspector was designed over the course of a ten-month collaboration with a diverse research team spanning visualization, HCI, security, and PL. TraceInspector integrates both static and dynamic app data into a single visualization interface, highlighting or connecting relevant temporal event sequences, method dependencies, and code executed by a given app. In a user study with nine RE users, we find that TraceInspector can speed up the RE process by making common RE tasks significantly faster and easier for RE users to perform.


Sneha Gathani, Peter Lim, Leilani Battle

Database management systems (or DBMSs) have been around for decades, and yet are still difficult to use, particularly when trying to identify and fix errors in user programs (or queries). We seek to understand what methods have been proposed to help people debug database queries, and whether these techniques have ultimately been adopted by DBMSs (and users). We conducted an interdisciplinary review of 112 papers and tools from the database, visualization and HCI communities. To better understand whether academic and industry approaches are meeting the needs of users, we interviewed 20 database users (and some designers), and found surprising results. In particular, there seems to be a wide gulf between users’ debugging strategies and the functionality implemented in existing DBMSs, as well as proposed in the literature. In response, we propose new design guidelines to help system designers to build features that more closely match users debugging strategies.


CHI 2020: SIGCHI Conference on Human Factors in Computer Systems | Acceptance Rate: 23.8%


Selected Course Projects


Creative

Apart from a growing and budding researcher, I am an absorbing painter and an inquisitive dissectologist. I enjoy most of my weekends painting. Over vacations, when I have more free time on hand, I am caught up making jigsaw puzzles.

I also enjoy exploring nature trails, sight-seeing and reading about histories of places.


CONTACT

Location:

2112, Brendan Iribe Center for Computer Science and Engineering,
University of Maryland,
College Park, MD - 20740